博客大数据分析:38880条博文揭示博主最爱写什么?
十年之约有个rss订阅的专题页面,这里通过十年的博主RSS采集了很多的博文,那么多博文,真是好奇大家都在写什么?那么,我们来一次博客大数据分析,看看这些年博主们都写了些什么?
数据采集
首先使用python进行一些数据采集,十年大约通过rss抓去了2500多页的博文数据,包括标题、链接、时间和博主的昵称,但是由于时间只显示了月份和日期,所以时间上无法统计出有意义东西了,看来只能从标题上下手了,先采集所有博文的标题并保存到磁盘上,代码如下:
import requests
import numpy as np
from bs4 import BeautifulSoup
from concurrent.futures import ThreadPoolExecutor

page_url = 'https://foreverblog.cn/feeds.html?page='  # 10年之约rss
number = 2592
titles = []

def collect_title(url):
    # 发送HTTP请求
    response = requests.get(url)

    # 解析HTML文档
    soup = BeautifulSoup(response.content, 'html.parser')
    # 使用正则表达式匹配
    articles = soup.findAll('article', class_='post')
    for article in articles:
        titles.append(article.h1.text.strip('\n\n'))
    print(url+'已经采集完成')

def saveArray(array):
    arr = np.array(array)
    np.savetxt('titles.txt',arr,fmt='%s',encoding='utf-8')
    print('保存所有标题完毕!')

if __name__ == '__main__':
    with ThreadPoolExecutor(max_workers=10) as executor:
        futures = [executor.submit(collect_title,page_url+str(i+1)) for i in range(number)]
        for f in futures:
            f.result()

    print(len(titles))
    saveArray(titles)
网速快的话,几分钟就搞定了,大约采集38880条博文标题!
jieba分词
整理数据,通过jieba中文分词提取有效的词语,然后对词语出现的频率进行排行,根据词语出现的频率前200生成一个词云图。具体代码如下:
import re
import jieba
import matplotlib.pyplot as plt
from wordcloud import WordCloud

titles = []
# 打开文件
with open('titles.txt', 'r', encoding='utf-8') as f:
    for line in f:
        titles.append(line)

words = []
for title in titles:
    text = re.sub('\W*', '', title)
    words.extend(jieba.cut(text,cut_all=True))

word_counts = {}
for word in words:
    if word not in word_counts:
        word_counts[word] = 0
    word_counts[word] += 1

sorted_word_counts = sorted(word_counts.items(), key=lambda x: x[1], reverse=True)

filtered_data = [(word, freq) for word, freq in sorted_word_counts if len(word) > 1]


# 只展示词语出现最多的前200个
top_200_words = filtered_data[:200]
# print(top_200_words)

font_path ='msyh.ttc'
# 创建WordCloud对象,并根据词频数据生成词云图
wordcloud = WordCloud(width=1920, height=1080,font_path=font_path, background_color="white").generate_from_frequencies(dict(top_200_words))

# 绘制词云图
plt.figure(figsize=(10, 5))
plt.imshow(wordcloud, interpolation="bilinear")
plt.axis("off")  # 不显示坐标轴
plt.show()
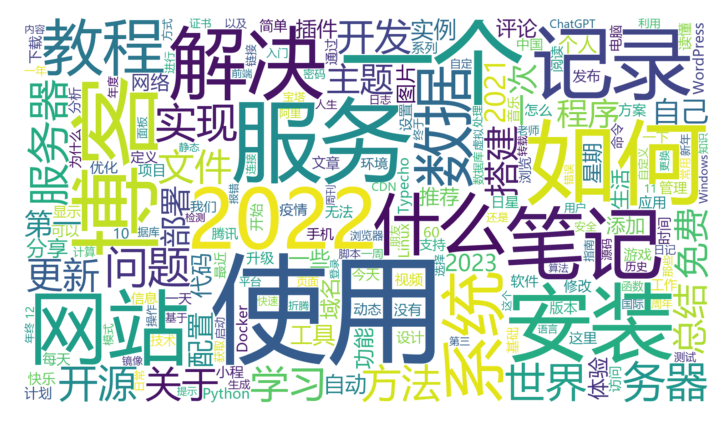
以下是一些排名靠前的词语:
('使用', 1543),
('一个', 862),
('如何', 855),
('博客', 848),
('服务', 847),
 ('安装', 714),
('2022', 677),
('网站', 657),
('记录', 651),
('笔记', 631),
('解决', 629),
('什么', 623),
('系统', 603),
('教程', 579),
('数据', 572),
('问题', 560),
('服务器', 550),
('务器', 550),
('世界', 517),
('实现', 513),
('方法', 474),
('开源', 467),
('学习', 450),
('开发', 418),
('关于', 413),
('文件', 412),
('更新', 406),
('免费', 386)
总体感觉大部十年的博主都是技术类型的啊,都是大佬了!最后贴上生成的云图,大家雅俗共赏:
总结
这个数据比较局限性,因为十年之约的博主并不能代替整个中文博客圈子,而且有很大一部分博主不会弄或是压根没弄RSS订阅,所以这个数据大家看看就好,不必较真。